The August Consumer Price Index for Urban Consumers (CPI-U) released this morning puts the August year-over-year inflation rate at 1.70%, off the May 19-month high of 2.13%. It is well below the 3.87% average since the end of the Second World War and 28 percent below its 10-year moving average.
For a comparison of headline inflation with core inflation, which is based on the CPI excluding food and energy, see this monthly feature.
For better understanding of how CPI is measured and how it impacts your household, see my Inside Look at CPI components.
For an even closer look at how the components are behaving, see this X-Ray View of the data for the past six months.
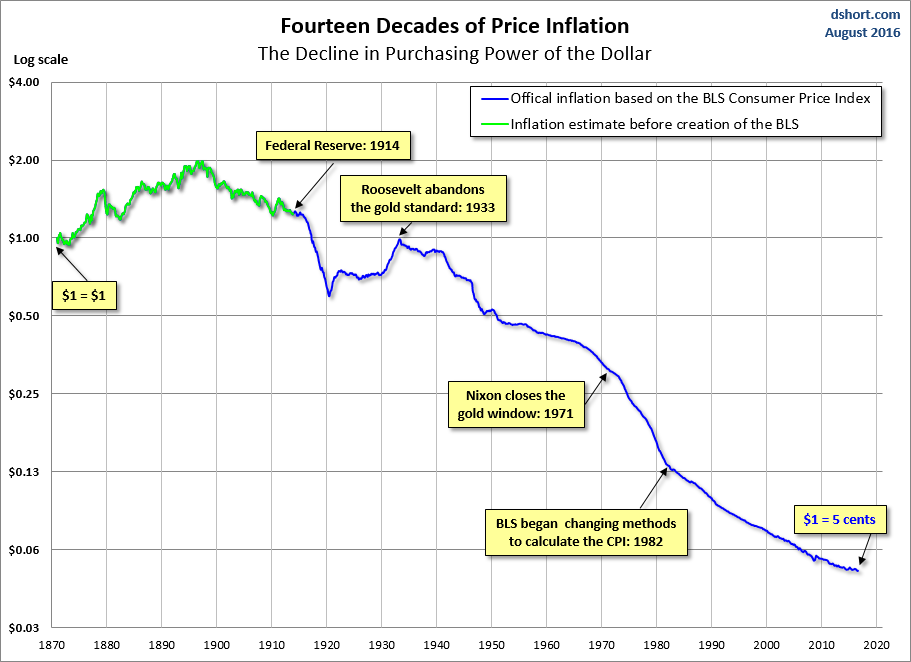
The Bureau of Labor Statistics (BLS) has compiled CPI data since 1913, and numbers are conveniently available from the FRED repository (here). My long-term inflation charts reach back to 1872 by adding Warren and Pearson's price index for the earlier years. The spliced series is available at Yale Professor (and Nobel laureate) Robert Shiller's website. This look further back into the past dramatically illustrates the extreme oscillation between inflation and deflation during the first 70 years of our timeline. Click here for additional perspectives on inflation and the shrinking value of the dollar.

Alternate Inflation Data
The chart below (click here for a larger version) includes an alternate look at inflation *without* the calculation modifications the 1980s and 1990s (Data from www.shadowstats.com).


On a personal note, I believe the current BLS method of calculating inflation is reasonably sound. As a first-wave Boomer who raised a family during the double-digit inflation years of the 1970s and early 1980s, I see nothing today that is remotely like the inflation we endured at that time. Moreover, government policy, the Federal Funds Rate, interest rates in general and decades of major business decisions have been fundamentally driven by the official BLS inflation data, not the alternate CPI. For this reason I view the alternate inflation data as an interesting but ultimately useless statistical series.
That said, I think that economist John Williams, the founder of Shadow Government Statistics, to which I subscribe, offers provocative analysis on a range of government statistics. While I do not share his hyperinflationary expectations, at least not based on current economic conditions, I find his skeptical view of government data to be filled with thoughtful insights.
For independent evidence that the Consumer Price Index is a reasonably accurate representation of the prices we pay, see the MIT Billion Prices Project US Daily Index.

For a more detailed independent analysis of US inflation and the official Consumer Price index, visit PriceStats.com.
For a long-term look at the impact of inflation on the purchasing power of the dollar, check out this log-scale snapshot of fourteen-plus decades.